
America's beauty-Business Capitals 2026
Georgia and Memphis lead the nation for hair, nail and skin care business density
America’s beauty sector is not concentrated only in famous fashion and entertainment hubs.
A new Cosmetology Guru analysis of U.S. Census Bureau data found that Georgia has the highest concentration of hair, nail and skin care business entities among the 50 states and Washington, D.C. Among the country’s 100 largest metropolitan areas, Memphis ranks first.
The analysis also reveals how heavily the sector depends on businesses without paid employees.
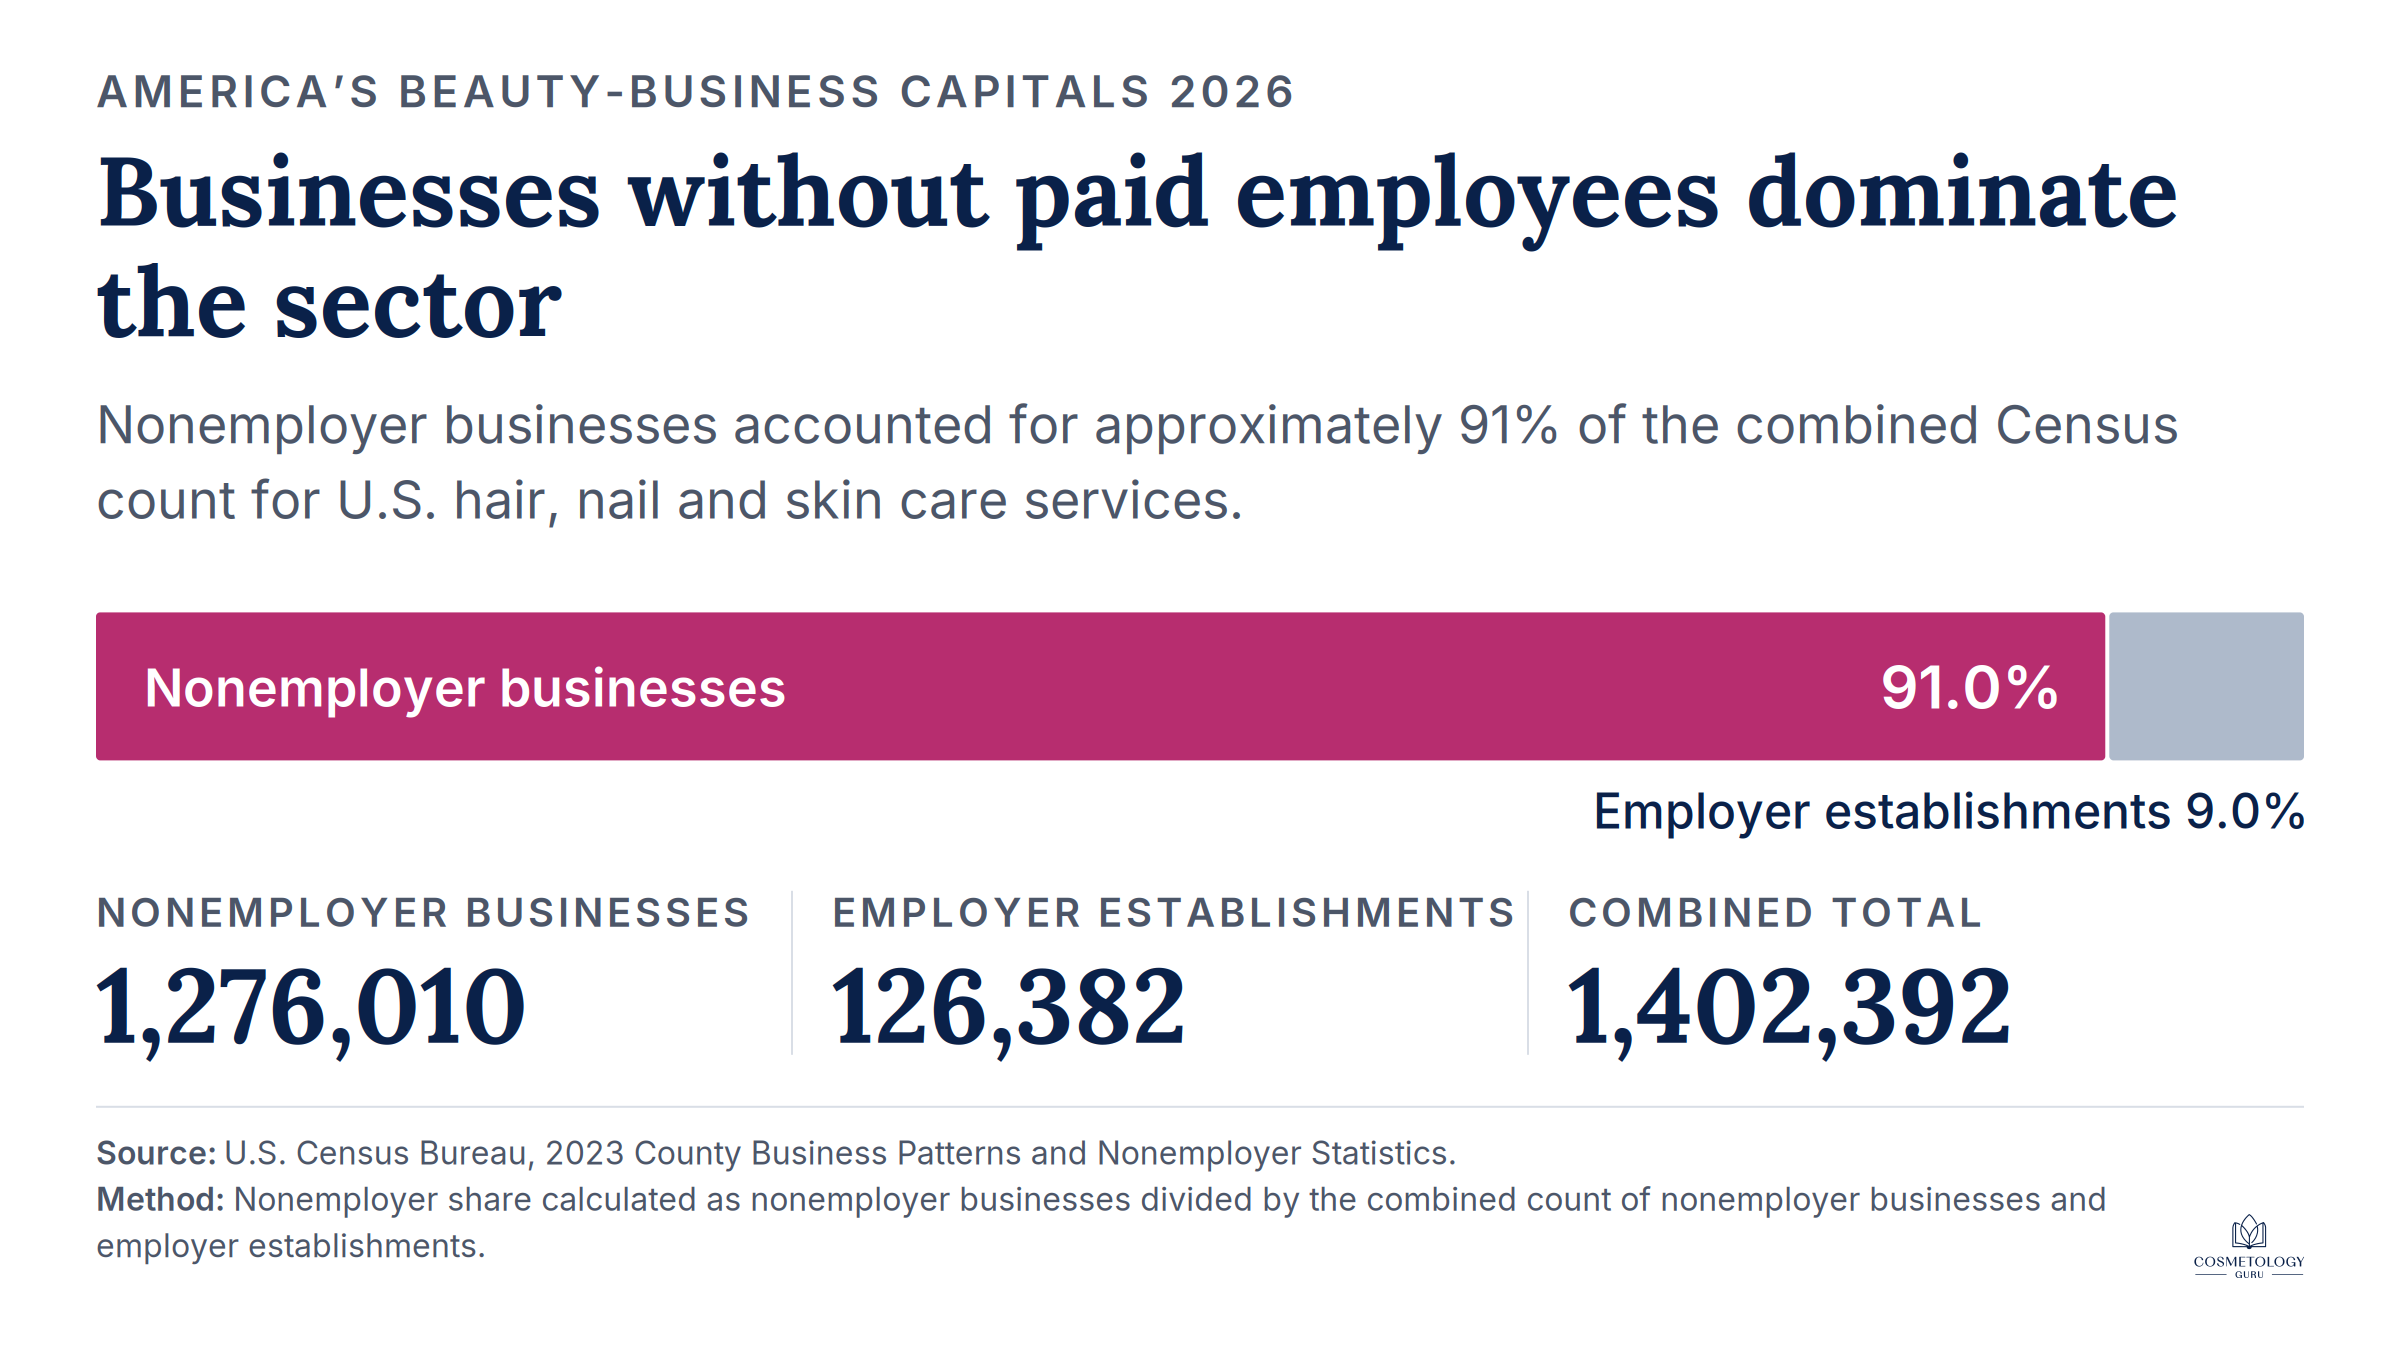
Across the 50 states and Washington, D.C., the Census data recorded:
-
- 126,382 employer establishments
-
- 1,276,010 nonemployer businesses
-
- 1,402,392 combined beauty-business entities
Nonemployer businesses accounted for approximately 91% of the combined count.
Key Findings
- Georgia ranks first among the 50 states and Washington, D.C., with 75.1 combined beauty-business entities per 10,000 residents.
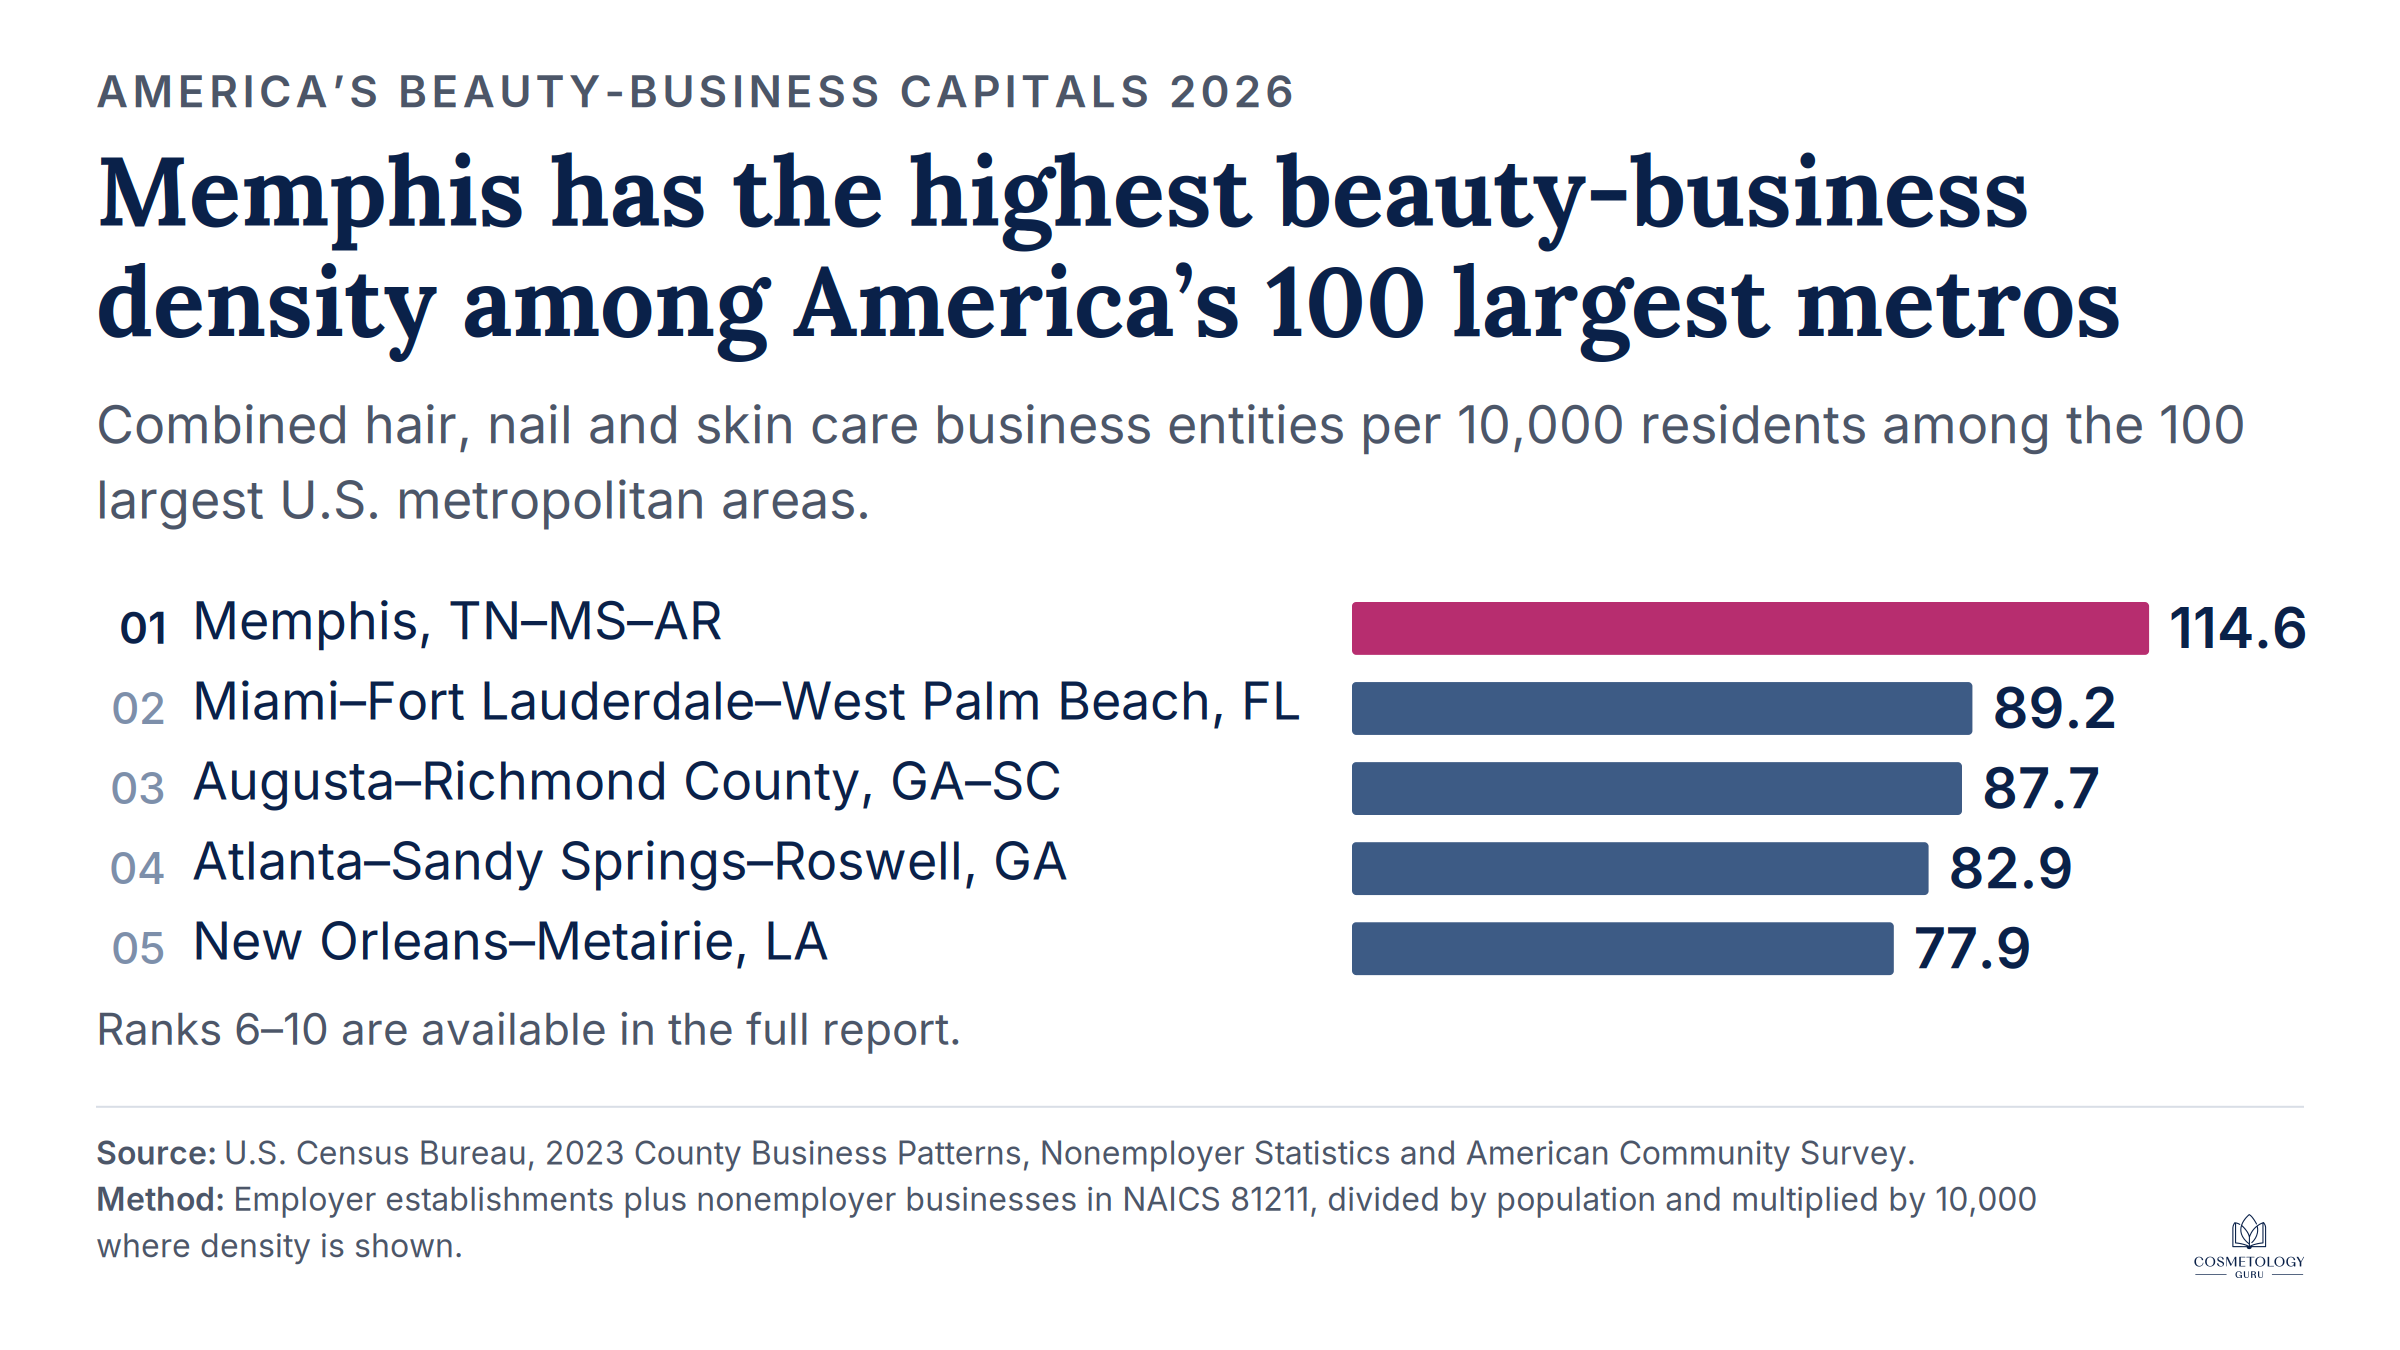
- Memphis ranks first among the 100 largest U.S. metropolitan areas, with 114.6 entities per 10,000 residents.
- Nonemployer businesses represent approximately 91% of the combined employer and nonemployer count.
- Texas has the largest total state market, with 160,921 combined entities.
- Eight of the ten highest-ranking states and nine of the ten highest-ranking large metropolitan areas are in the Census Bureau’s South region.
Georgia Has the Highest State-Level Beauty-Business Density
Georgia recorded 82,855 combined employer establishments and nonemployer businesses in hair, nail and skin care services.
With a 2023 population of approximately 11 million, that equals 75.1 entities per 10,000 residents, the highest concentration among the 50 states and Washington, D.C.
Louisiana ranked second at 65.9 per 10,000 residents, followed by Mississippi at 64.4 and Florida at 63.9.
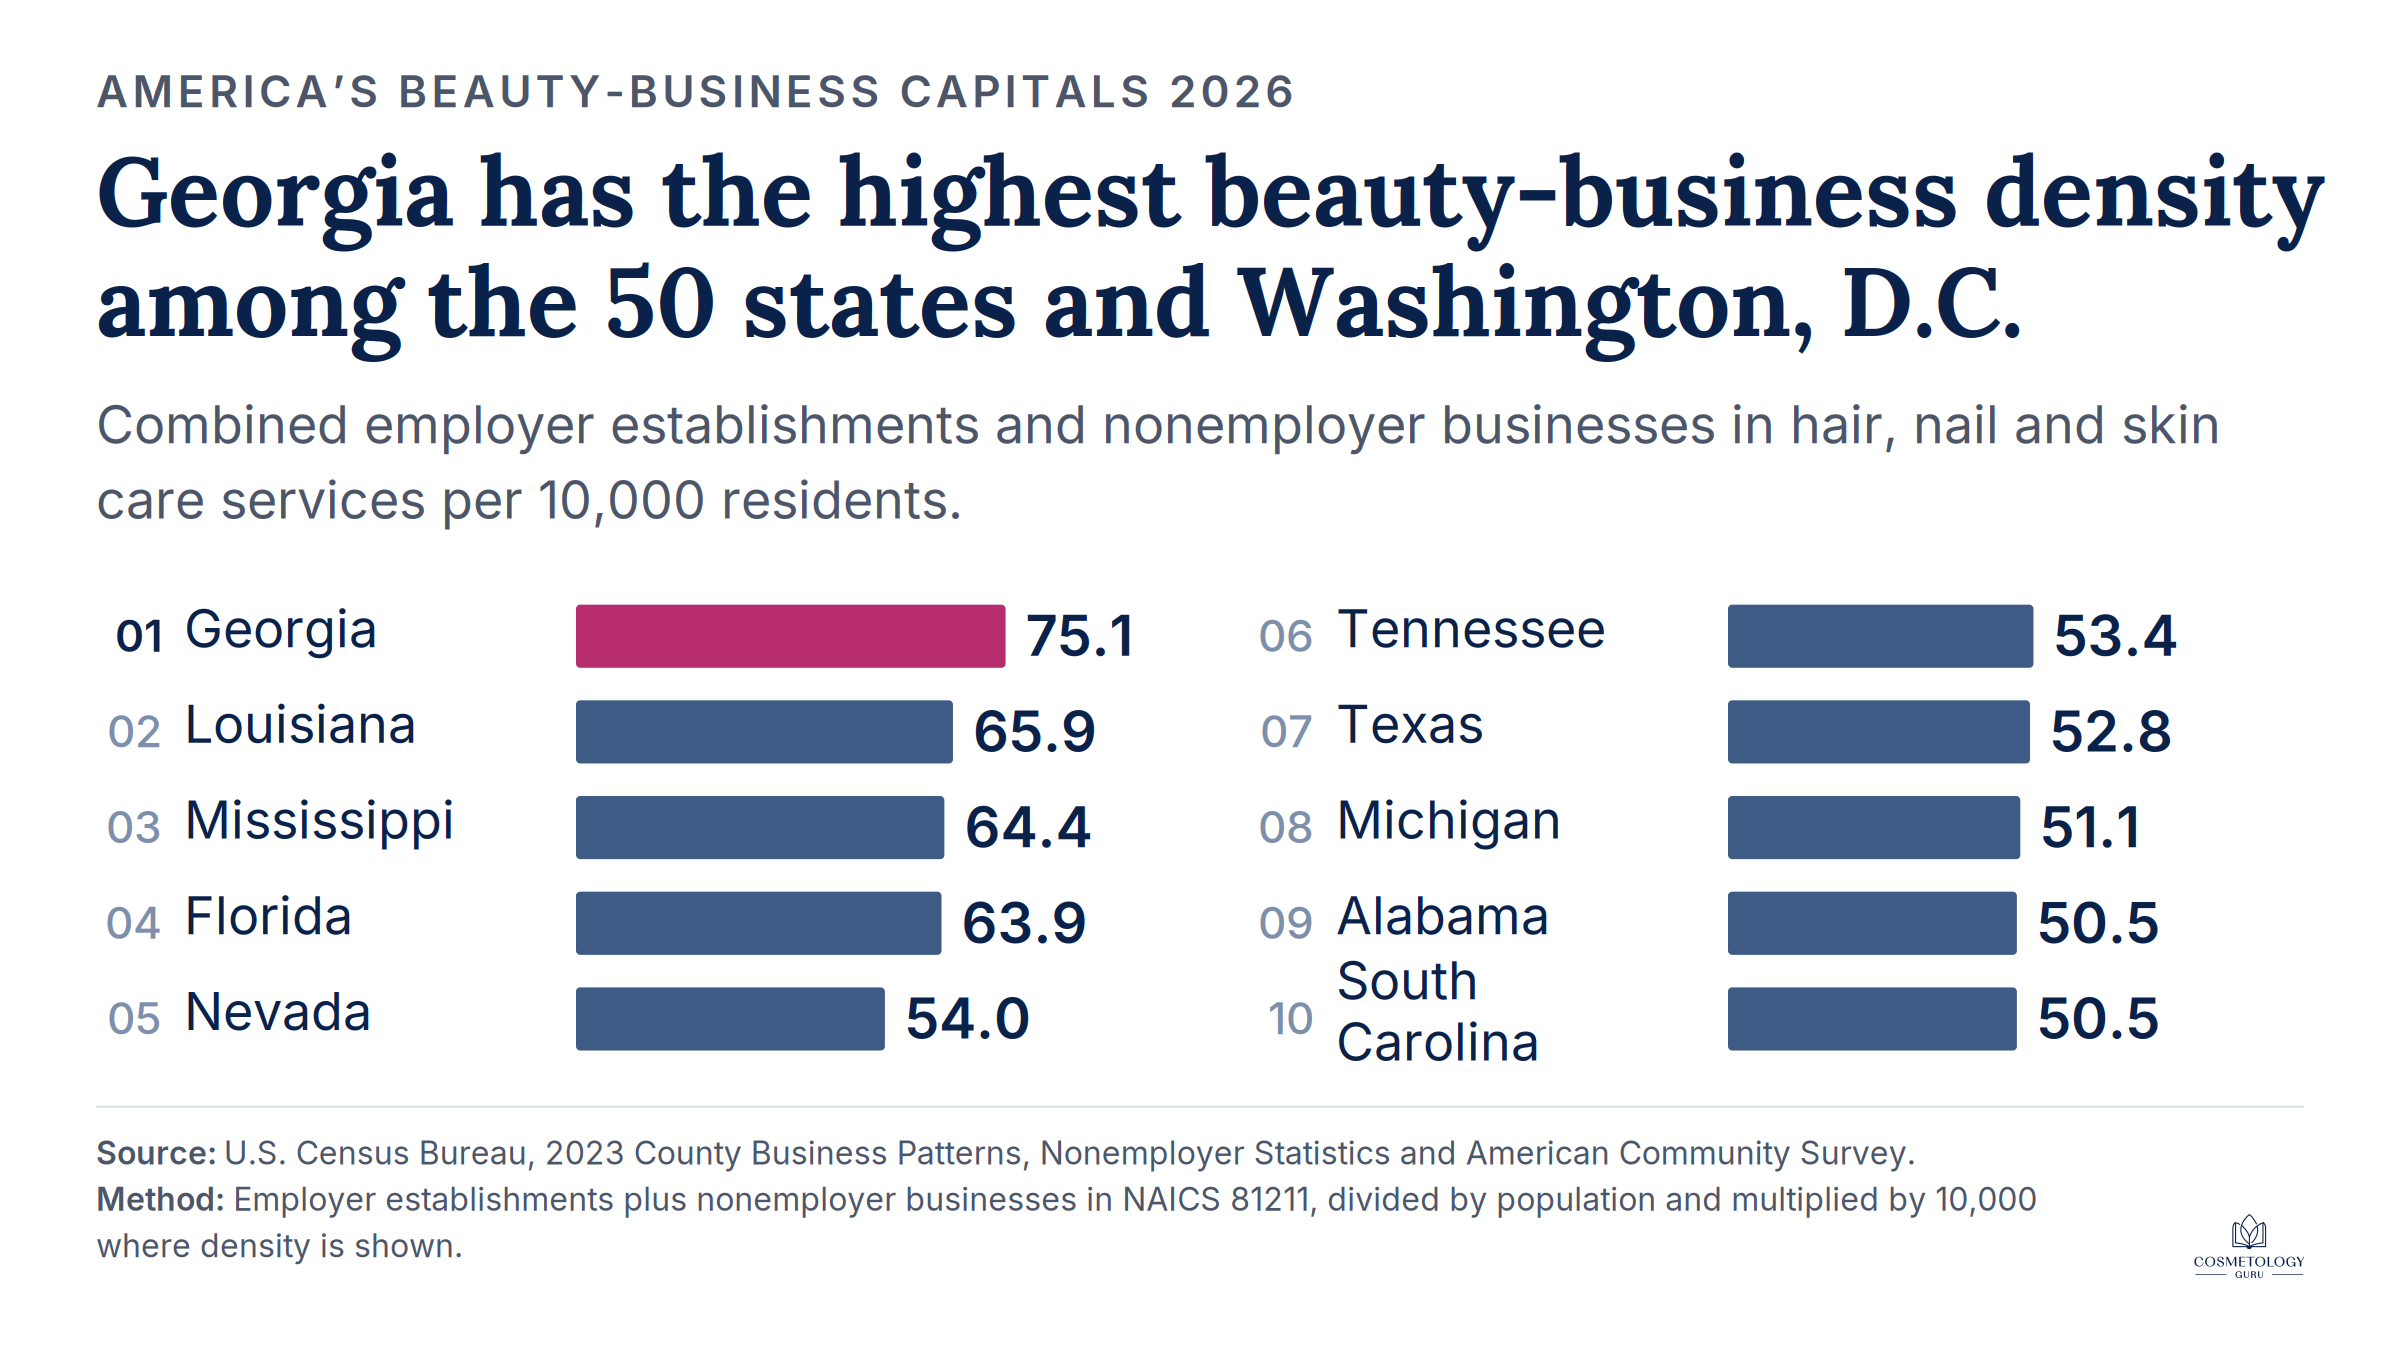
The results reveal a clear regional pattern. Georgia, Louisiana, Mississippi and Florida occupy the first four positions, while eight of the top ten states are in the Census Bureau’s South region.
Texas Has the Largest Total Beauty-Business Market
Per-capita density and total market size produce different rankings.
Texas ranks seventh by density but has the country’s largest combined state count, with 160,921 beauty-business entities. Florida follows with 144,473, while California ranks third with 141,209.
| State | Combined entities | Entities per 10,000 residents |
|---|---|---|
| Texas | 160,921 | 52.8 |
| Florida | 144,473 | 63.9 |
| California | 141,209 | 36.2 |
| Georgia | 82,855 | 75.1 |
| New York | 68,177 | 34.8 |
Texas therefore represents the largest market by total count, while Georgia leads after adjusting for population.
Memphis Leads America’s 100 Largest Metropolitan Areas
Memphis recorded 15,301 combined beauty-business entities, equal to 114.6 per 10,000 residents.
That was the highest density among the 100 largest U.S. metropolitan areas. Miami ranked second at 89.2, followed by Augusta at 87.7, Atlanta at 82.9 and New Orleans at 77.9.
Nine of the top ten large metropolitan areas are in the South. Detroit is the only top-ten metro outside the Census South region.
The Memphis Metro Far Exceeds Traditional Beauty Hubs
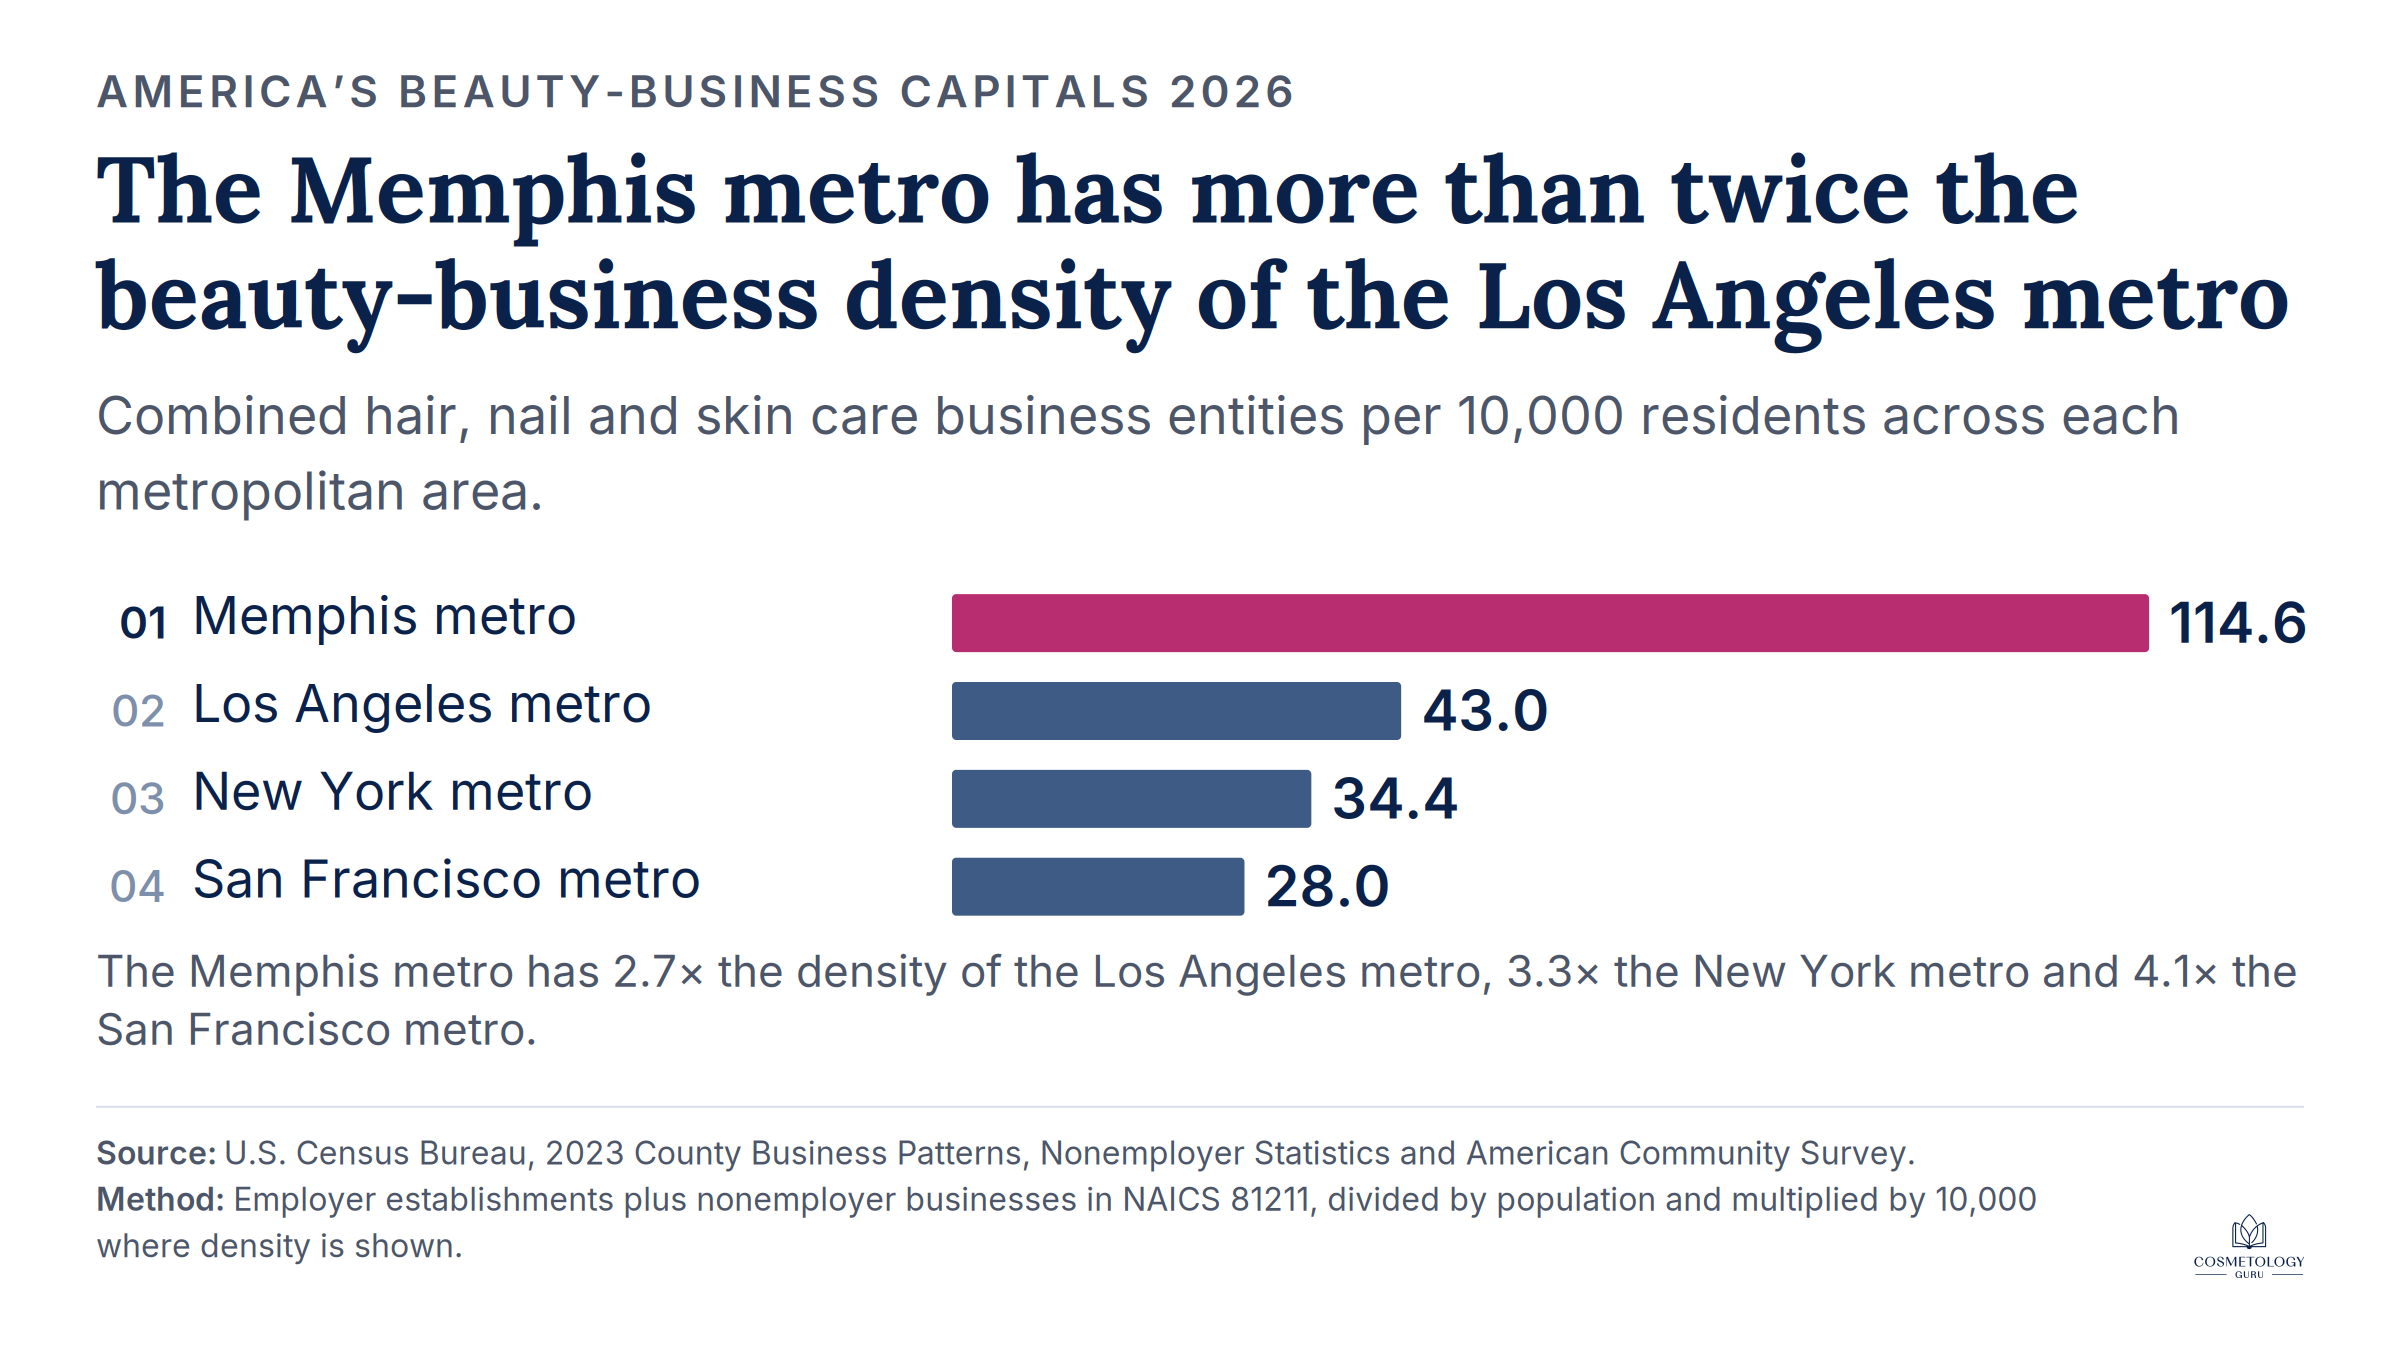
The Memphis metro’s beauty-business density was substantially higher than that of several metropolitan areas more commonly associated with fashion, media and beauty culture.
Memphis recorded 114.6 combined entities per 10,000 residents, compared with:
- 43.0 in the Los Angeles metro
- 34.4 in the New York metro
- 28.0 in the San Francisco metro
That means the Memphis metro had approximately 2.7 times the density of Los Angeles, 3.3 times the density of New York and 4.1 times the density of San Francisco.
Miami Combines High Density With a Large Total Market
Miami–Fort Lauderdale–West Palm Beach ranked second among the 100 largest metropolitan areas by beauty-business density, with 89.2 combined entities per 10,000 residents.
It also had 55,168 combined entities, the second-largest absolute count among the 100 metropolitan areas included in the analysis.
This makes Miami unusual within the ranking: it places near the top both after adjusting for population and by total market size.
Category Leaders
Separate rankings were calculated for barber shops, beauty salons and nail salons.
State leaders
| Category | Leading state | Entities per 10,000 residents |
|---|---|---|
| Barber shops | Louisiana | 8.1 |
| Beauty salons | Mississippi | 46.2 |
| Nail salons | Georgia | 21.8 |
Louisiana recorded the highest barber-shop density, Mississippi led for beauty salons and Georgia ranked first for nail salons.
Metropolitan leaders
| Category | Leading metropolitan area | Entities per 10,000 residents |
|---|---|---|
| Barber shops | Memphis, TN–MS–AR | 14.3 |
| Beauty salons | Memphis, TN–MS–AR | 79.8 |
| Nail salons | Miami–Fort Lauderdale–West Palm Beach, FL | 28.3 |
Memphis led two of the three metropolitan categories, ranking first for both barber shops and beauty salons. Miami recorded the highest nail-salon density.
Methodology and Downloads
This section sets out the data, definitions and calculations behind America’s Beauty-Business Capitals 2026, together with direct links to the official Census Bureau data used. Journalists are welcome to reproduce the figures with attribution to Cosmetology Guru.
Data year
America’s Beauty-Business Capitals 2026 uses 2023 data — the latest common official year available across every dataset required for this analysis at the time the research was conducted. Using a single reference year for both business counts and population avoids combining measurements from different periods.
Industry included
The analysis covers businesses classified under NAICS 81211: Hair, Nail, and Skin Care Services.
Separate category results were also calculated for:
- NAICS 812111 — Barber Shops
- NAICS 812112 — Beauty Salons
- NAICS 812113 — Nail Salons
NAICS 81211 covers qualifying hair, nail and nonmedical skin care services. It does not represent every business that might be considered part of the broader beauty industry, and excludes beauty-product retailers, cosmetology schools and medical skincare providers unless they are classified under the selected code.
Employer establishments
Employer-establishment figures came from the U.S. Census Bureau’s 2023 County Business Patterns (CBP), which covers businesses with paid employees and reports operating establishments, employment and payroll.
Parameters used: Industry NAICS 81211 · Legal form of organization: Total · Employment-size class: Total.
Official sources:
- State County Business Patterns data (Census API)
- Metropolitan County Business Patterns data (Census API)
- County Business Patterns programme page
Nonemployer businesses
Nonemployer figures came from the U.S. Census Bureau’s 2023 Nonemployer Statistics (NES), which covers businesses without paid employees that are subject to federal income tax. These may include sole proprietorships and other businesses operating without an employee payroll.
Parameters used: Industry NAICS 81211 · Legal form of organization: Total · Receipt-size class: Total.
Official sources:
- State Nonemployer Statistics data (Census API)
- Metropolitan Nonemployer Statistics data (Census API)
- Nonemployer Statistics programme page
Population
Population figures came from the 2023 American Community Survey 1-Year Estimates, using total-population variable B01003_001E.
Official sources:
- State population data (Census API)
- Metropolitan population data (Census API)
- American Community Survey programme page
Ranking universe
The state ranking includes all 50 U.S. states and Washington, D.C. Puerto Rico and other U.S. territories were excluded.
The metropolitan ranking includes the 100 largest U.S. metropolitan statistical areas, selected by 2023 American Community Survey population. Micropolitan statistical areas were excluded.
Ranking calculation
For each state or metropolitan area, beauty-business density was calculated as:
(Employer establishments + nonemployer businesses) ÷ population × 10,000
This produces the number of combined beauty-business entities per 10,000 residents.
Statistical-unit limitation
County Business Patterns and Nonemployer Statistics do not use identical statistical units. CBP reports employer establishments, generally representing operating locations with paid employees. NES reports businesses without paid employees.
Their sum is therefore described throughout this report as a combined count of employer establishments and nonemployer businesses, shortened for readability to combined beauty-business entities. It should not be interpreted as an exact count of unique companies, individual business owners, licensed beauty professionals, physical salon locations or individual practitioners.
Employer and nonemployer figures are published separately in the downloadable data so that each component can be examined on its own.
Industry-classification editions
The 2023 County Business Patterns API reports the selected industries using NAICS 2017 fields, while the 2023 Nonemployer Statistics API reports them using NAICS 2022 fields. The selected industry codes retain corresponding labels across the two releases; both classification editions are disclosed here for transparency.
Data notes
Nonemployer share varies widely by market. Nationally, nonemployer businesses account for approximately 91% of the combined count. Individual markets depart substantially from that figure — Mississippi records the highest state share at approximately 97.4% and New Jersey the lowest at approximately 73.7%. Memphis, the leading metropolitan area, also records a nonemployer share well above the national figure. These reflect differences in local market structure rather than data errors, and the employer and nonemployer components are published separately in the downloadable data.
Close results. Where two areas are separated by a margin smaller than the precision of the underlying data, they are described as effectively tied rather than ranked against one another.
What the rankings measure
The rankings measure the concentration of employer establishments and nonemployer businesses relative to population. They do not measure:
- Business profitability
- Consumer spending or demand
- Service quality
- Business survival rates
- The number of licensed professionals
- Whether a market is oversupplied or underserved
- The best location in which to open a beauty business
- Growth or decline over time
Historical growth and decline would require a separate multiyear analysis using comparable Census releases.
Download the data
- Full state rankings (CSV) — all 50 states and Washington, D.C.
- Top 100 metro rankings (CSV) — the 100 largest metropolitan areas
- Complete research workbook (XLSX) — employer and nonemployer counts, population-adjusted figures, category breakouts and source notes
How to cite this research
Cosmetology Guru, America’s Beauty-Business Capitals 2026, published July 30. https://cosmetologyguru.com/americas-beauty-business-capitals-2026/
Charts and figures from this report may be republished free of charge with attribution to Cosmetology Guru. For data queries, additional breakdowns or interviews, contact contact@cosmetologyguru.com.
About Cosmetology Guru
🚀 Cosmetology Guru provides state-specific study guides and exam prep for cosmetology students across the U.S.
Our mission is to empower students with the knowledge and resources they need to pass their licensing exams and launch successful careers.
🌐 Website: cosmetologyguru.com
📧 Press Inquiries: contact@cosmetologyguru.com
📞 Media Contact: Lisa Martinez
Press & Media Contact
👨💻 For journalists, bloggers, and influencers
✔️ Need exclusive data, interviews, or quotes?
✔️ Looking for state-specific insights?
✔️ Want to feature Cosmetology Guru in your publication?
📩 Contact our press team:
📧 contact@cosmetologyguru.com
📞 Lisa Martinez